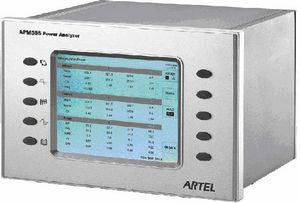
APM556 power quality analyzer: measurement, event recording and system integration
The APM556 power quality analyzer is an instrument for plants and substations that need to measure electrical parameters and evaluate supply quality on site. The APM556 is designed around a large-size LCD touchscreen, so routine checks can be done on the device itself. The device combines basic electrical parameter measurement, real-time waveform and trend graph display, harmonic measurement and analysis, and triggered recording of voltage sags, swells and interruptions, flicker, and voltage/current unbalance. It also judges the power quality of the supply system according to IEC standards and provides multiple communication ports for integration into a networked power quality management system. This page summarises what the instrument does, how it is specified, and where it is typically installed.
What the APM556 power quality analyzer measures and does
The instrument's documented functions serve both short-term troubleshooting and continuous monitoring of a supply point. Its functions fall into four working areas:
- Basic electrical parameter measurement. The APM556 measures the fundamental electrical quantities of the monitored circuit. Readings are shown on the large-size LCD touchscreen and are available to the communication interfaces.
- Waveform and trend display. Live waveforms and trend graphs are displayed in real time on the touchscreen, which lets an engineer compare the instantaneous shape of a voltage or current signal against its recent history without external analysis software.
- Harmonic measurement and analysis. Harmonic content is measured and analysed on the instrument, supporting assessment of distortion at the point of connection and of the loads connected to it.
- Event recording and supply quality evaluation. The APM556 records voltage sags, swells and interruption events, flicker, and voltage/current unbalance, with triggered storage. It judges the power quality of the supply system according to IEC standards, so recorded events can be read against a defined framework rather than as raw captures.
For plant buyers, the practical consequence is that one instrument covers steady-state measurement and the short-duration events that are often the actual cause of trips, resets and contactor drop-out.
Key features
- Large-size LCD touchscreen display for local operation, waveform viewing and parameter reading.
- Basic electrical parameter measurement in a single instrument.
- Real-time waveform and trend graph display.
- Harmonic measurement and analysis performed on the device.
- Recording of voltage sags, swells and interruption events with triggered storage.
- Flicker and voltage/current unbalance recorded as part of the same event set.
- Power quality judgement of the supply system according to IEC standards.
- Multiple communication ports for connection to supervision and management systems.
- Networkable with power quality management software to build a power quality management system across several monitoring points.
Specifications
The table below reflects the documented function set of the APM556. Numerical accuracy, sampling rate, memory depth, port count and similar figures are not listed here; request the current datasheet from LOGGON TECH for the values that apply to your configuration.
| Model | APM556 |
|---|---|
| Product type | Power quality analyzer |
| Display | Large-size LCD touchscreen |
| Measurement | Basic electrical parameter measurement |
| Display functions | Waveform and trend graph display in real time |
| Harmonics | Harmonic measurement and analysis |
| Events recorded | Voltage sags, swells and interruption events; flicker; voltage/current unbalance; triggered storage |
| Supply quality evaluation | Judges power quality of the supply system per IEC standards |
| Communications | Multiple communication ports; networkable with power quality management software |
Options and configuration
The documented configuration points for the APM556 are the communication ports and the software layer above the instrument. Because the analyzer can network with power quality management software, a single unit can run stand-alone with local display and event storage, or operate as one node in a multi-point power quality management system. Define the following before ordering:
- Stand-alone or networked. State whether the unit will be read locally only or polled by power quality management software; this determines which communication ports are needed and how the system is structured.
- Monitoring point role. Incoming supply evaluation against IEC criteria, harmonic survey of a distribution board, and event capture on a sensitive feeder place different demands on triggered storage settings.
- Event threshold settings. Sag, swell, interruption and unbalance thresholds should be agreed with the party who will read the records, so that stored events match the contractual or internal quality targets.
Applications
The APM556 is suited to survey and audit work at points where supply quality has operational or contractual consequences:
- Main incoming panels and transformer secondary distribution, where sags, swells and interruptions explain downstream trips.
- Feeders supplying variable-speed drives, rectifiers, UPS systems and other non-linear loads, where harmonic measurement and analysis supports distortion assessment.
- Busbars feeding sensitive production lines, where voltage/current unbalance and flicker affect motor heating and control stability.
- Multi-building or multi-workshop sites building a power quality management system on a common software platform.
- Installations where recorded events must be judged against IEC standards for reporting to a landlord, utility or internal engineering department.
FAQ
Does the APM556 record events automatically, or only when someone is watching the screen?
Recording is triggered and stored in the instrument; it does not depend on an operator viewing the display. Voltage sags, swells and interruption events, flicker, and voltage/current unbalance are captured with triggered storage, so the touchscreen is used for setup and review rather than for capturing the event itself.
Can the analyzer be used without power quality management software?
Yes. The APM556 measures electrical parameters, displays waveforms and trends, analyses harmonics and evaluates supply quality locally, with results shown on the large-size LCD touchscreen. The communication ports and software connection are what allow several units to be networked into a power quality management system when site-wide reporting is required.
Which IEC standard applies to the supply quality judgement?
The instrument judges the power quality of the supply system according to IEC standards; the specific standard and evaluation limits depend on the supply system and the assessment being made. Confirm the applicable standard and the settings for your project with LOGGON TECH when specifying the unit.
What accuracy and memory figures apply to the APM556?
Accuracy, sampling, memory depth and port count are not provided in the available summary and are not stated on this page. Request the current datasheet for the documented values before comparing the APM556 with alternative instruments or writing it into a specification.
For the full technical datasheet, terminal and port details, and the documented values to enter into your specification, contact LOGGON TECH through the contact page and state the monitoring point, the supply system, and whether the APM556 will operate stand-alone or as part of a networked power quality management system.